User Guide
Working with Audit Logs
Overview
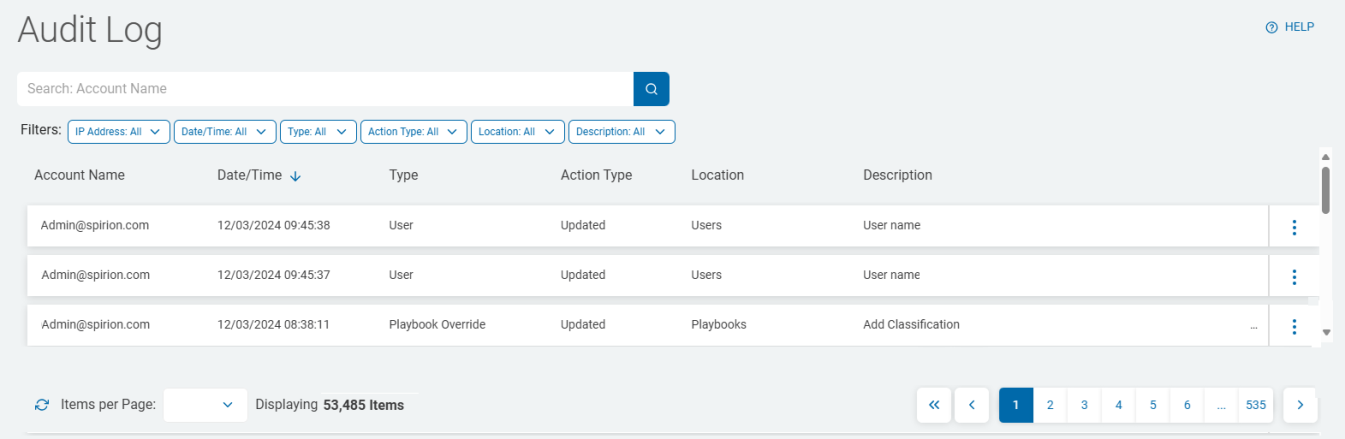
The Audit Log page is found under Reports > Audit Log.
The Audit Log page table displays activities taken in the system such as:
-
Policy changes
-
Playbook changes
-
Date and time the log was produced
-
Action performed on the Audit log
-
and more
-
The Audit Log page table enables you to view and filter this information.
Audit Events
-
Spirion Agents v13-13.5 only: Audit Log events queue in RabbitMQ and then move to the database.
-
The event then continues to Audit Log Table.
-
The Audit Log does not retain non-functional event types.
-
The event state must be successful to be recorded.
-
Any event that fails is removed from the Audit Log.
-
When the "Type" filter uses only event types triggered in Spirion Sensitive Data Platform, they are displayed on the Audit Log page.
-
See the How to Use Filters to Find an Audit Log section.
-
How to Access and View Audit Logs
How to Grant Users Access to the Audit Log Page
-
Access to the Audit Log page is limited to selected users and roles.
-
To access Audit Logs, an Administrator must apply the Manage privilege in the Manage Administrative Settings area for the user. See Working with User Management
-
The Audit Log page is available only to users who are members of a role which contain the Manage privilege.
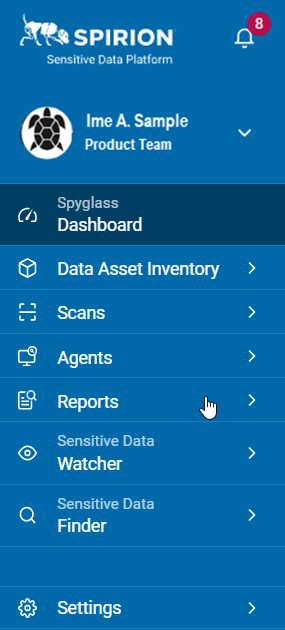
How to View Audit Logs
Procedure:
-
From the left menu, click Reports.
-
Click Audit Log.
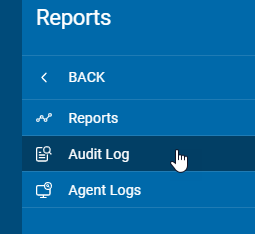
-
The Audit Log page appears.
Audit Log Table Columns
The Audit Log table displays these columns:
| Field | Description |
| Date/Time | The timestamp of when the action occurred. |
| Type |
The action that was logged:
|
| Action Type |
The type of action that was taken:
|
| Location |
The location within Spirion Sensitive Data Platform where the action occurred:
|
| Description | Includes Action Type, Name, and Type |
| More Options menu (3 vertical dots) | View Details |
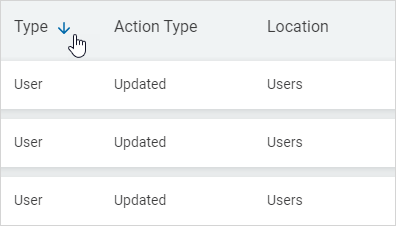
How to Sort Table Columns
Procedure:
-
Click a column to sort ascending.
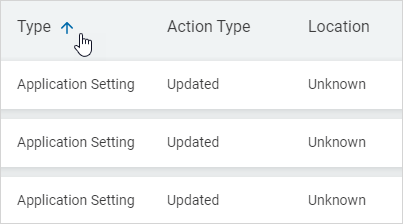
-
Click the column again to sort descending.
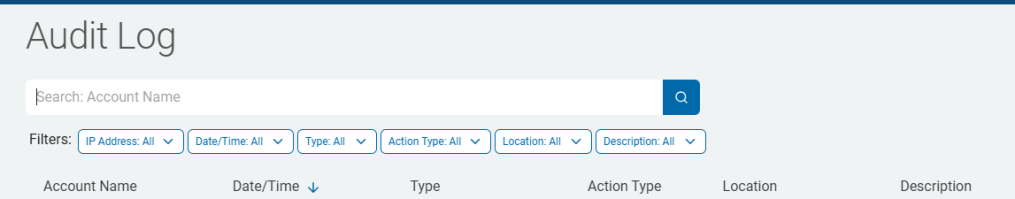
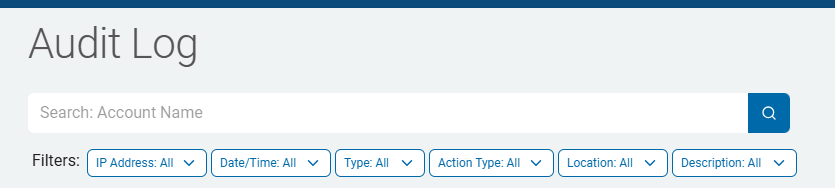
How to Search for an Audit Log
You can search for a log by Account Name, Action Type, and Location.
To search for a log:
-
Type in the name of the log in the Search entry field.
-
Click the magnifying glass (search) icon or press Enter.
-
The result displays.
-
Click the x to clear the search.
How to View Audit Log Details
To view the details of an Audit Log:
-
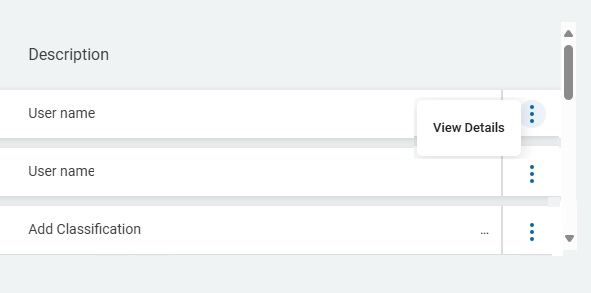
Locate the log you want to view in the Audit Log list.
-
Click the More Options menu at the end of the column.
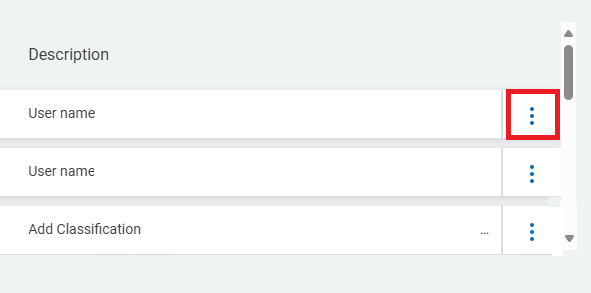
-
Click View Details.
-
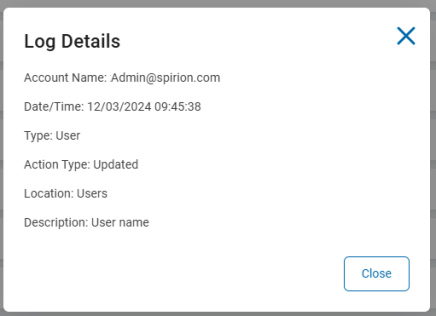
The Log Details window opens.
-
Click Close to close the window and return to the previous screen.
How to Apply Filters to Locate Specific Log Characteristics
Do the following steps to apply filters to locate specific audits:
-
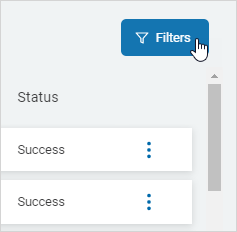
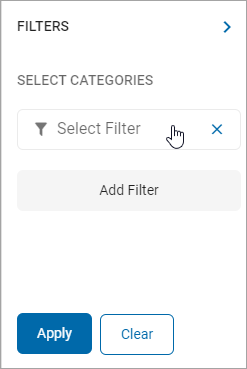
In the top right of the screen, click Filters.
-
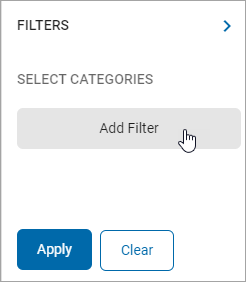
Click Add Filter.
-
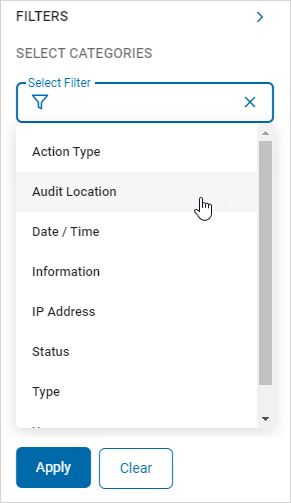
Click Select Filter.
-
Select an option from the Select Filter drop-down list :
-
Action Type
-
Audit Location
-
Date/Time
-
Information
-
IP Address
-
Status
-
Type
-
User
-
-
Select one or more filter categories from the drop-down list:
| Action Type: Select one: |
|
|
Audit Location: Select an option from the drop-down list:
|
| Date/Time: Use the calendar picker to select a date. |
|
Information: Type information in the box. |
| IP Address: Type IP address in the box. |
|
Status: Select one:
|
|
Type: Select an option from the drop-down list:
|
| User: Type the user name in the box. |
-
Click X to remove a specific filter.
-
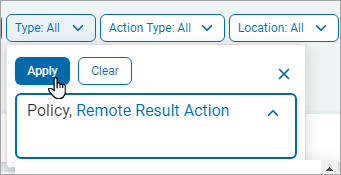
Click Apply to add filters.
-
Click Clear to remove all filters.
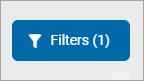
The Filter button displays the number of filters applied.
Note: Adding multiple filters can extend the wait time for the search results.
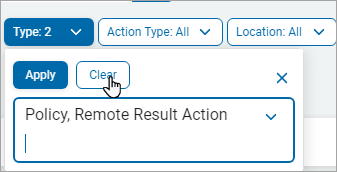
How to Use Filters to Find an Audit Log
Note: The Type filter only uses and displays event types triggered in Sensitive Data Platform.
To use the filter feature to find an Audit Log based on specific criteria:
-
In the upper left of the screen, go to the Filters.
-
For the selection criteria, select one or more items from the list of filters.
-
IP Address
-
For audits, the user's IP Address is preferred.
-
Date/Time
-
Type
-
Action Type
-
Location
-
Description
-
-
Click Apply to apply the filter to the Audit Log list.
-
Click Clear and then click Apply to remove the filter.