
User Guide
Creating Your Own Custom Reports
Overview
Sensitive Data Platform (SDP) Custom Reports can be created to support different use cases for your data.
Use cases and report details are provided below.
Actions by Locations
Match locations with remediation or management actions applied via playbooks:
-
Endpoints:
-
Target Name
-
-
Locations:
-
Location
-
Classifications
-
-
Matches:
-
Data Type Name
-
Match Count: Aggregate: Sum
-
Resolution
-
Action
-
Action Start Date/Time
-
-
Filter(s):
-
Resolution
-
Does Not Equal
-
Unmanaged
-
Example Report 1: Social Security Numbers
Create a report that shows which company laptops contain Social Security Numbers (SSN)
Using the Matches by Location you can determine the physical location of specific data value(s): Which company laptops have Social Security Numbers (SSN) on them?
-
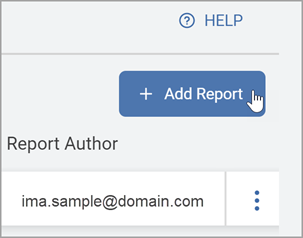
Click Add Report.
-
The Create Report wizard is displayed.
-
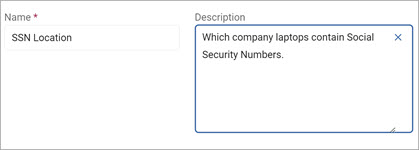
On the Basic Information screen, our example uses the following:
-
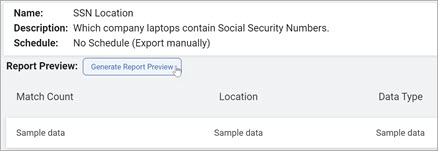
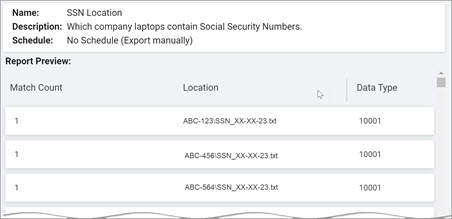
Name: SSN Location
-
Description: Which company laptops contain Social Security Numbers
-
-
Click Next .
-
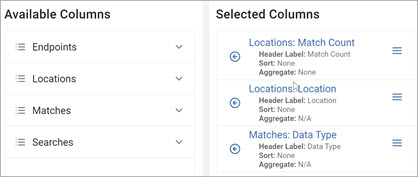
In the Columns Setup screen Available Columns section, select the following to move to the Selected Columns section:
-
Locations Settings:
-
Match Count
-
Location
-
-
Matches:
-
Data Type
-
-
Click Next .
-
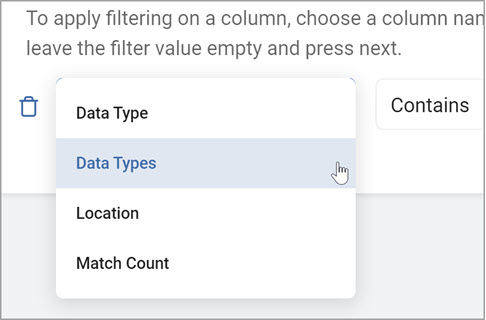
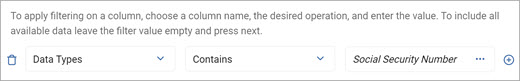
On the Filters screen, add the following:
-
From the left column, select Data Type from the drop-down list.
-
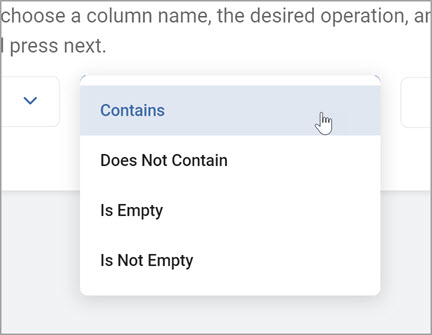
From the center column, select Contains from the drop-down list.
-
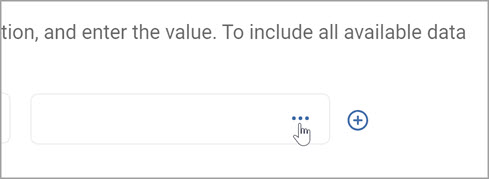
From the right column, click the ellipse to open the Select Items pop-up window.
-
In the Select Items pop-up window:
-
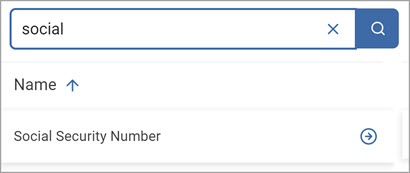
Enter Social in the search box.
-
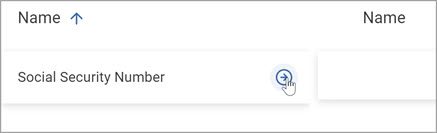
In the left column, locate Social Security Number and click the right arrow to select the value.
-
Click OK to add.
-
-
Click Next .
-
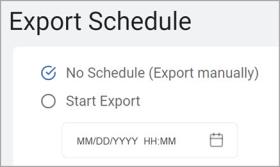
On the Export Schedule screen, leave the No Schedule (Export manually) option selected to manually run the report. (See Working with Custom Reports for other scheduling options.)
-
Click Next.
-
On the Summary screen, click Generate Report Preview to preview your report (optional).
-
Click Confirm to generate the preview.
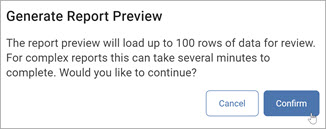
Note: The report preview will load up to 100 rows of data for review. For complex reports this can take several minutes to complete.
-
The report preview is displayed.
-
Click Finish & Save to save the report.
-
To view the report:
-
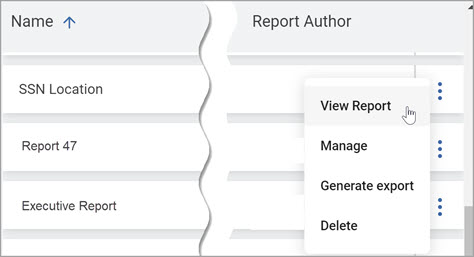
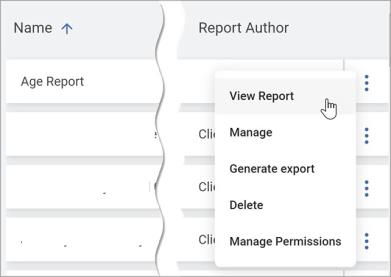
Locate the new report in the Custom Reports section.
-
Click the more options menu then click View Report.
-
-
To export the report:
-
Locate the new report in the Custom Reports section.
-
Click the more options menu then click Export Report.
-
-
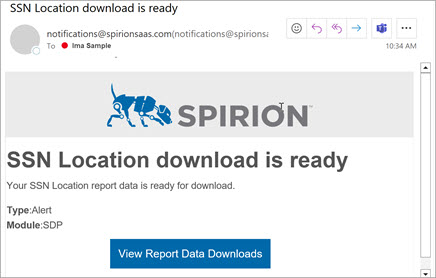
A Report Export notification message is displayed.
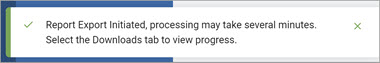
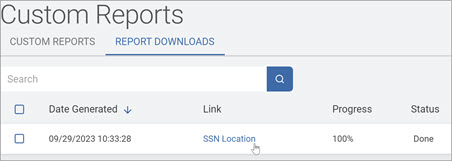
Note: It may take several minutes to generate the report. You can view the report progress in the REPORT DOWNLOADS tab.
-
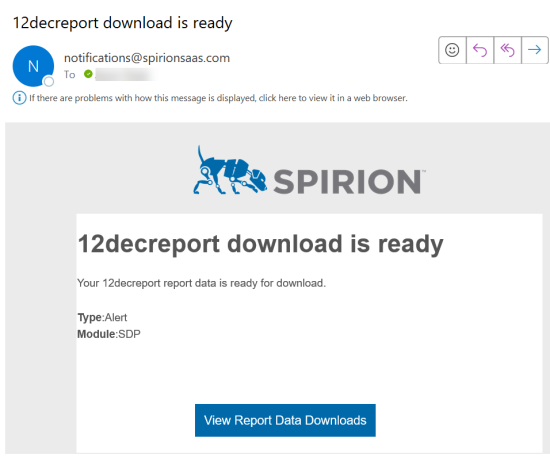
You receive an email notification when the report is ready.
-
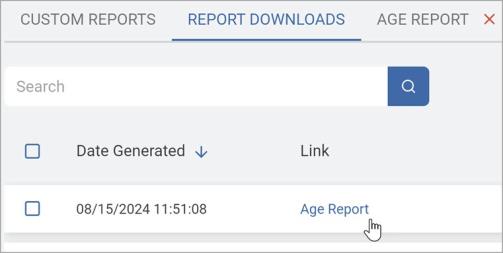
Locate your report in the REPORT DOWNLOADS tab and click on the link to download to your computer to use the data in your report software.
Age Profiling
Modified date of unstructured match result locations:
-
Endpoints: Target Name
-
Locations: Location
-
Locations: Date/Time Modified
-
Locations: File Owner
-
Filter(s):
-
Date/Time Modified
-
Not Empty
-
Example 2: Discover the Age of Your Records
Use Date/Time Modified to discover the age of your records.
Procedure:
-
Click Add Report.
-
The Create Report wizard is displayed.
-
In the Name box, type the name of the report.
-
In the Description box, type a summary of intent of the report, such as the age of the records.
-
Click Next.
-
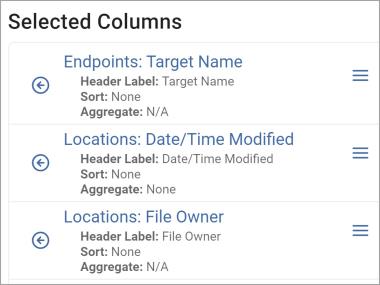
In the Columns Setup page Available Columns section, move the following columns to the Selected Columns section:
-
Endpoints: Target Name
-
Locations: Location
-
Locations: Date/Time Modified
-
Locations: File Owner
-
-
Click Next.
-
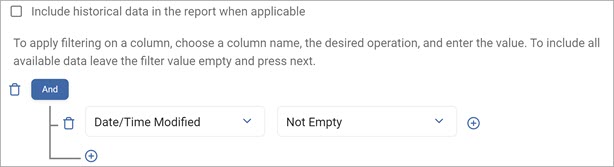
On the Filters screen, select Date/Time Modified and Not Empty from the drop-down lists.
-
Click Next.
-
On the Export Schedule screen, leave the No Schedule (Export manually) option selected to manually run the report. (See Working with Custom Reports for other scheduling options.)
-
Click Next.
-
On the Summary screen, click Generate Report Preview to preview your report (optional).
Note: The report preview loads up to 100 rows of data for review. For complex reports this can take several minutes to complete.
-
Click Finish & Save to save the report.
-
To view the report:
-
Locate the new report in the Custom Reports section.
-
Click the kebab menu then click View Report.
Export the Report
Procedure:
-
To export the report:
-
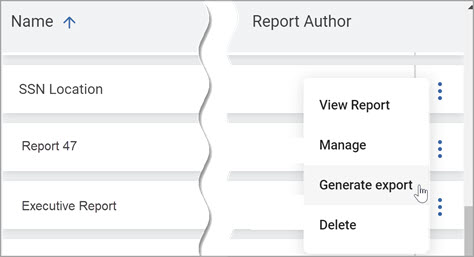
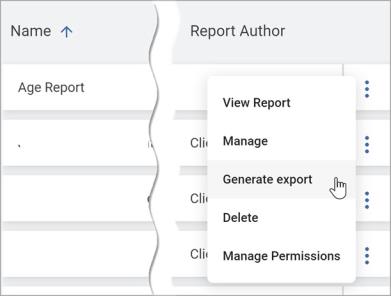
Locate the new report in the Custom Reports section.
-
Click the kebab menu then click Generate Export.
-
A report notification message is displayed.
.Note: It may take several minutes to generate the report. You can view the report progress in the Downloads tab.
-
When the report is ready you will receive an email notification.
-
Locate your report in the REPORTS DOWNLOAD tab. Click the link to download the ZIP file to your computer to use the data in your report software.
Classifications by Location
-
Individual locations with classification labels
-
Endpoints: Target Name
-
Locations: Location
-
Locations: File Type
-
Locations: Classifications
-
Filter(s):
-
Classification Names
-
Is Not Empty
-
Data Type Summary
Count of matches found for each data type:
-
Matches: Data Type Name
-
Matches: Match Count
-
Aggregate: Sum
-
-
Filter(s):
-
N/A
-
Matches by File Type
Total match count by file type:
-
Locations: File Type
-
Locations: Match Count
-
Aggregate: Sum
-
-
Filter(s):
-
N/A
-
Matches by Location (Structured)
Match summary of structured data scans:
-
Endpoints: Target Name
-
Locations: Location
-
Matches: Database Column Names
-
Matches: Data Type Name
-
Matches: Match Count
-
Aggregate: Sum
-
-
Locations: Classifications
-
Filter(s):
-
Database Column Name
-
Is Not Empty
-
Matches by Location (Unstructured)
Match summary of unstructured data scans:
-
Endpoints: Target Name
-
Locations: Location
-
Matches: Data Type Name
-
Matches: Match Count
-
Aggregate: Sum
-
-
Locations: Classifications
-
Locations: File Type
-
Locations: Internal Location Type
-
Locations: Date/Time Created
-
Locations: Date/Time Modified
-
Locations: Date/Time Accessed
-
Locations: File Owner
-
Locations: File Size
-
Filters(s):
-
Internal Location Type
-
Does Not Equal
-
Database Table
-