
User Guide
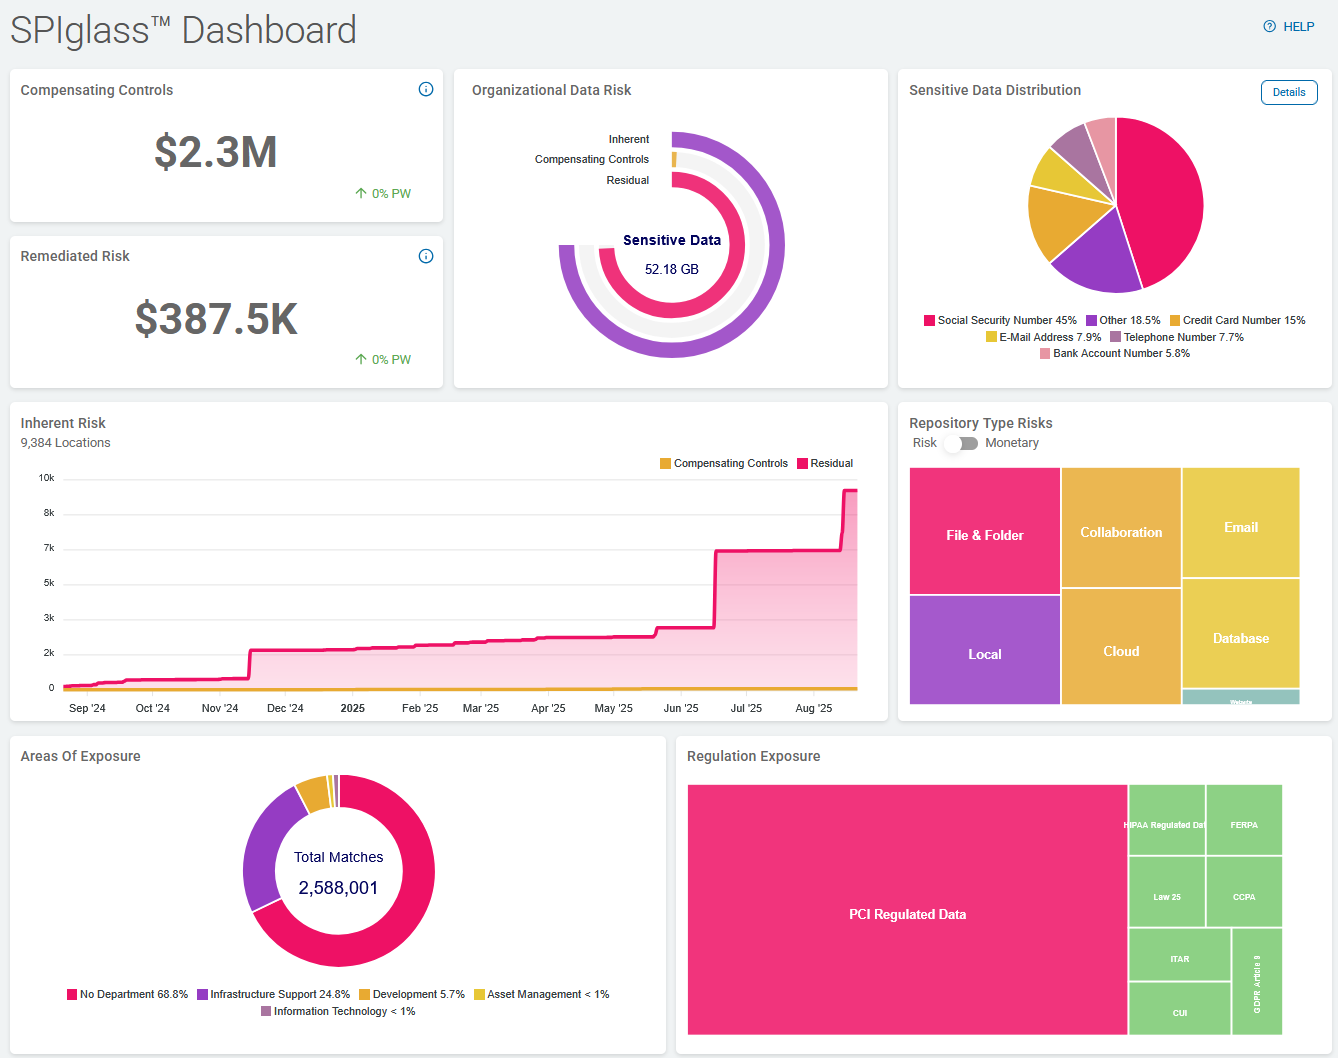
SPIglass™ Dashboard
Overview
The Sensitive Private Information Dashboard (SPIglass™) Dashboard is a dashboard with a specific focus on:
-
Key metrics
-
Findings of interest to board members or executives
Each chart depicts a high-level roll up of data that reveals insights into your sensitive, personal, and private data, and where to focus when managing this data.
Compensating Controls
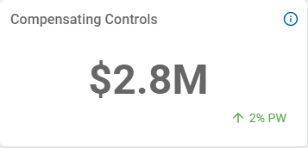
Compensating Controls: Displays the total cost of all sensitive data matches with compensating controls in place.
These include:
-
Restricted Access
-
Script Execution
-
Quarantine
-
Ignore
-
Playbook User Action
Note: All costs are taken from the dollar value assigned to each data type in the global data types settings in the Data Asset Inventory.
See Working with Data Asset Inventory for more information.
PW Indicator
-
The arrow and number percent % indicates the direction (increase or decrease) and change (in percent %) over the past week (PW)
-
In the screenshot above, the total cost of all amount of all sensitive data matches with compensating controls in place has increased 2% in the past week.
Remediated Risk
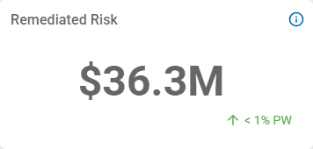
Remediated Risk: Displays the total cost of all sensitive data matches that have been found and subsequently removed from view via the shred or redact process.
-
Data Type:
-
Dollar Value (Default $8.00)
-
-
Leverage Playbook Actions:
-
Shred
-
Redact
Note: All costs are taken from the dollar value assigned to each data type in the global data types settings in the Data Asset Inventory.
See Working with Data Asset Inventory for more information.
-
PW Indicator
-
The arrow and number percent % indicates the direction (increase or decrease) and change (in percent %) over the past week (PW)
-
In the screenshot above, the total cost of the amount of all sensitive data matches with compensating controls in place has increased less than 1% in the past week.
Organizational Data Risk
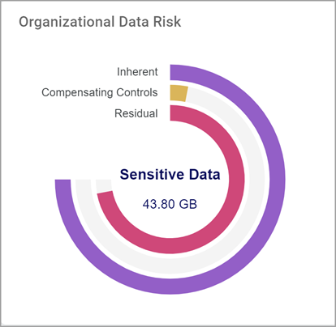
Organizational Data Risk displays all the scanned data in your environment.
The data is displayed by:
-
Inherent: Represents all sensitive data identified
-
Displayed in the purple-colored, outermost line
-
The Inherent line is the sum of the Compensating Controls line and the Residual line.
-
Amount of sensitive data (volume) is displayed in the center of the circle labeled Sensitive Data (43.80 GB in the screenshot above)
-
-
Compensating Controls: Data that has some form of protection or remediation in place (Managed Data in Spirion Sensitive Data Platform).
-
Displayed in the amber-colored, middle line.
-
Managed data represents the sensitive data that has been addressed in one of the following ways:
-
Restrict Access
-
Script
-
Quarantine
-
Ignore
-
User Action
-
-
-
Residual: Displays deleted data in your environment that is exposed (at-risk).
-
Displayed in the alert pink colored portion of the innermost line
-
This is specifically matched data that is still in your environment and has not been managed to reduce accessibility or remediated.
Note: The total of Compensating Controls data and Residual data is equivalent to the total Sensitive data, but is likely not equivalent to the total Scanned data.
-
Optimum vs. Problematic Organizational Data Risk
Below is an example of low organizational data risk vs. high organizational data risk as displayed by the Organizational Data Risk circle graph.
![]()
-
Organizational Data Risk is:
-
Low when Compensating Controls, shown in the amber middle line in the semi-circle chart, is much longer than the Residual line, shown in Alert Pink on the inside.
-
High (and requires action) when Compensating Controls, shown in the amber middle line in the semi-circle chart, is much shorter than the Residual line, shown in Alert Pink on the inside.
-
-
Recall, the Inherent line (purple line in the graph above) represents all identified sensitive data and is the sum of the Compensating Controls semi-circle line and the Residual semi-circle line.
Sensitive Data Distribution
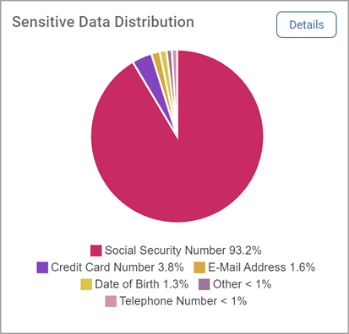
Sensitive Data Distribution is a pie chart that displays the following:
-
The 5 sensitive data types with the most matches
-
All other data type matches are shown as Other.
-
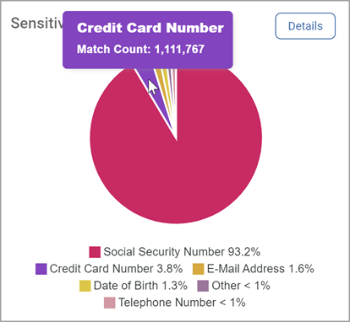
Mouse over a section to view exact match count for the sensitive data type.
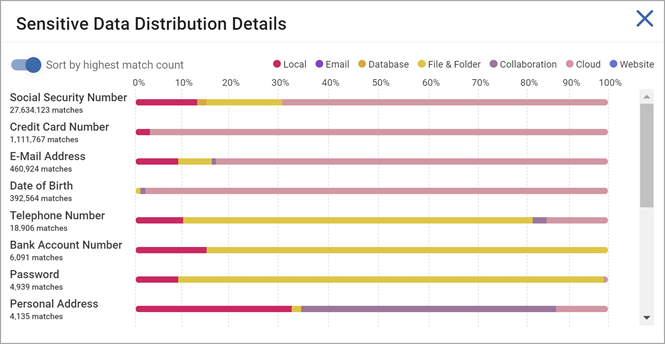
Sensitive Data Distribution Details
-
Click Details in the top right corner to view the sensitive data distribution across all repository types, including:
-
Local
-
Email
-
Database
-
File & Folder
-
Collaboration
-
Cloud
-
Website
-
-
The bar graph shown is a version of the Scans Dashboard Sensitive Data Distribution chart. (See Using Scans Dashboard for more information.)
-
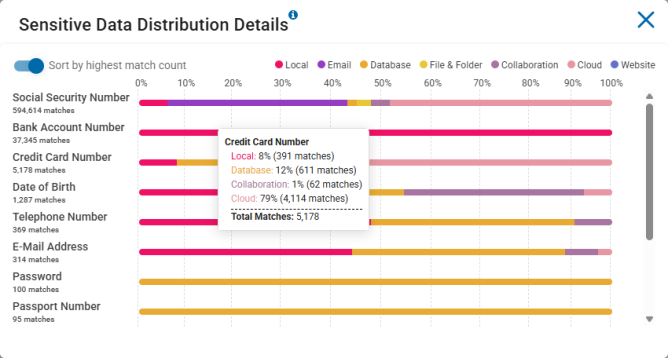
Mouse over a sensitive data type bar in the chart to see the breakdown of that data type across all repository types.
-
Example
-
In the screenshot above, for example, Credit Card Number data types were matched a total of 5,178 times.
-
The breakdown of repository types is as follows:
-
8% of the 5.178 matches were found on Local sources (remote machines, file servers, workstations, etc.)
-
12% of the 5.178 matches were found on Database sources (Oracle, PostgreSQL, mongoDB, Snowflake, etc.)
-
1% of the 5.178 matches were found on Collaboration sources (SharePoint, Bitbucket)
-
79% of the 5.178 matches were found on Cloud sources (Dropbox, OneDrive, Amazon S3, etc.)
-
Note: No Credit Card Number matches were found on either Email or File & Folder sources
-
-
Inherent Risk
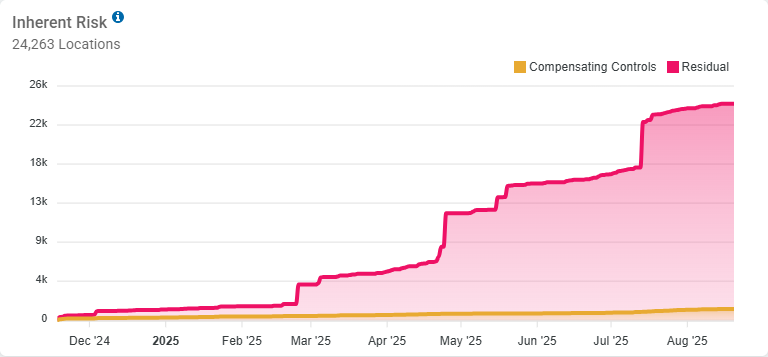
Inherent Risk displays the risk of the data in your environment at any given point in time.
-
This chart shows Residual data on top of Compensating Controls data
-
Residual data, also known as ambient data, refers to information that remains on storage devices even after attempts to delete or erase it.
-
Compensating Controls are actions applied to sensitive data discovered in your environment to mitigate risks. These actions can include:
-
Restricted Access: Limiting who can view or interact with the data
-
Script Execution: Running scripts to manage or remediate data
-
Quarantine: Isolating sensitive data to prevent unauthorized access
-
Ignore: Choosing not to act on certain data matches
-
User Actions: Engaging users to take specific actions based on policies
-
-
-
Remediated data is filtered out as those items are no longer At Risk
-
The file count is Managed vs Unmanaged (Playbook Actions for Managed Data)
-
Y Axis
-
Indicates the total number of locations with sensitive data
-
In the screenshot above, there are a total of 24,263 locations
-
-
The Residual Data total is represented stacked on top of the total data with Compensating Controls applied
-
Residual Data is represented in Alert Pink
-
Data with Compensating Controls is represented in Amber
-
-
X Axis
-
Indicates the month of the year in which the inherent risk was at the level indicated on the Y axis.
-
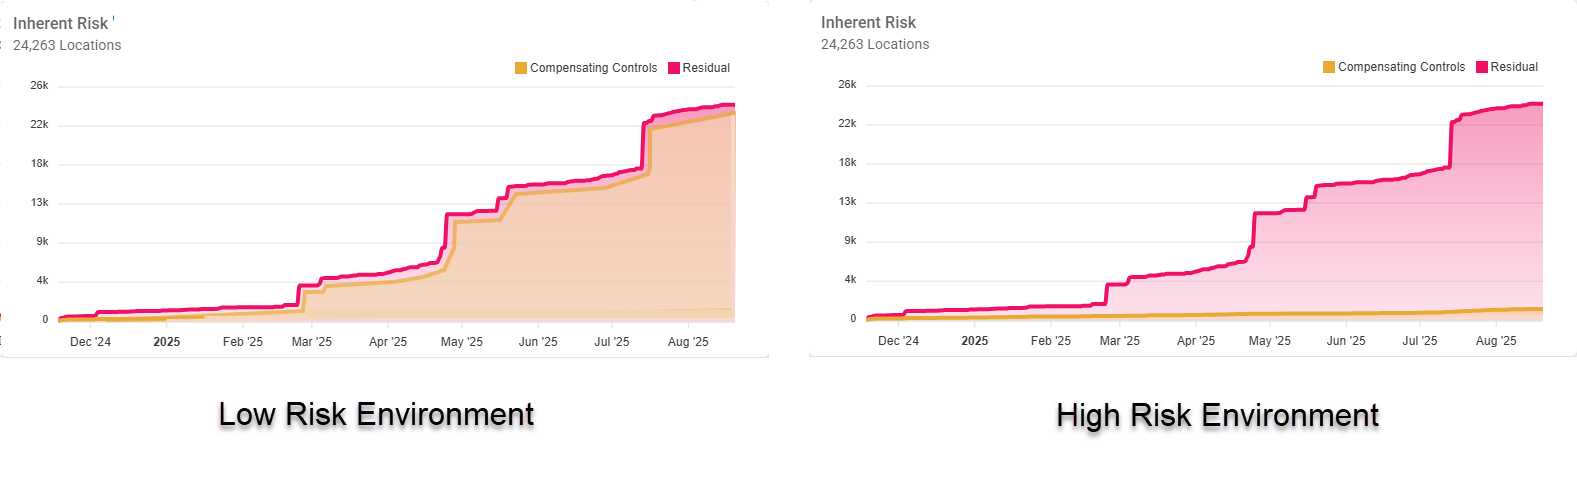
Environments with High vs. Low Inherent Data Risk
Below is an example of an environment with low Inherent data risk (left) vs. one with high Inherent data risk (right).
-
Inherent (data) Risk is:
-
Low when Compensating Controls, represented by the amber shaded portion, tracks equally with Residual data.
-
High (and requires action) when Compensating Controls, represented by the amber shaded portion, lags behind Residual data.
-
-
The gap between the Compensating Controls line and the Residual data line should be as small as possible at all times
-
If your environment resembles the High Risk Environment graph below, you must take action to apply compensating controls and lower the risk of your sensitive data as soon as possible!
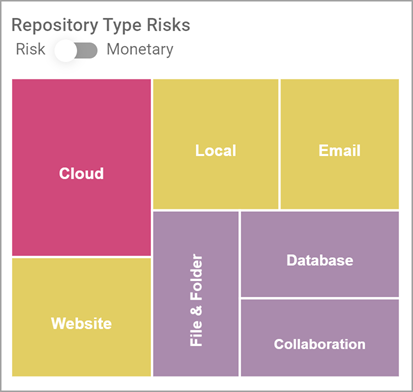
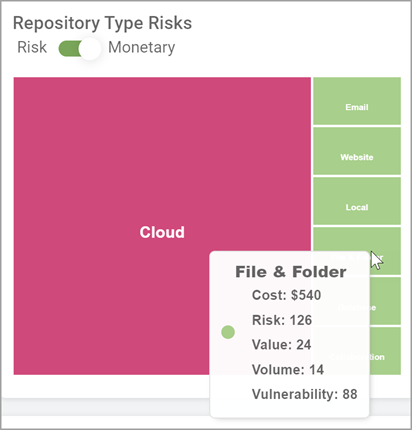
Repository Type Risk
-
Repository Type Risk displays the SDV3™ risk score of each repository type in your environment (Asset Assignment for all Scanned Targets)
Note: This feature requires that Data Type Values and Asset Security Measures are entered.
-
The score is calculated by averaging the risk score associated with all assets within a specific repository
-
Repository Types:
-
Cloud
-
Email
-
Local (Scans)
-
Database
-
Files & Folders (Remote Scans)
-
Website
-
Collaboration Tools
-
-
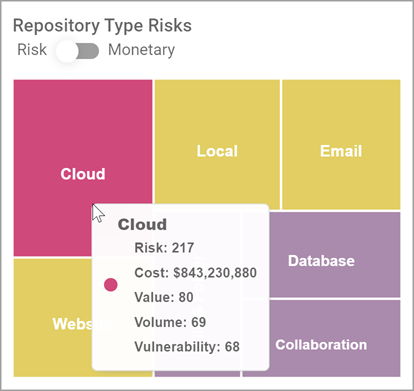
Hover over one of the following repository types to view its details:
-
Repository Type Risks score is indicated by the relative square size in the chart
-
Each square is color-coded based on a set risk score threshold with the highest risk score always highlighted in Alert Pink
-
-
The Risk/Monetary toggle enables you to display the chart by monetary value, which may not correspond with the highest risk if the repository has a low vulnerability but a high value
-
Monetary values are indicated in the chart in the same manner as risk score
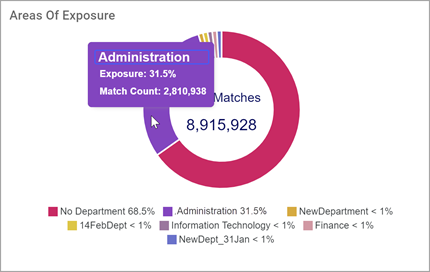
Areas of Exposure
Areas of Exposure displays the total sensitive data matches in each department as identified in the Data Asset Inventory (DAI).
-
Sensitive data distribution (as a percent % of the total) by department
-
Percent of each data type for Total Findings (Scan for Data Types)
-
Areas of exposure for each department
-
Asset department assignment in Data Asset Inventory
-
Department examples: Administration, Finance, IT, Dev
-
-
Scanned Targets assigned to assets in Data Asset Inventory
-
Each section represents a department or matches without a corresponding department
-
Hover over a section to view a total match count of each department
-
The total match count for the environment is displayed in the center of the chart
-
The legend lists each match (as a percent % of the total) for each department
-
For example: Human Resources, Sales, Engineering, etc.
-
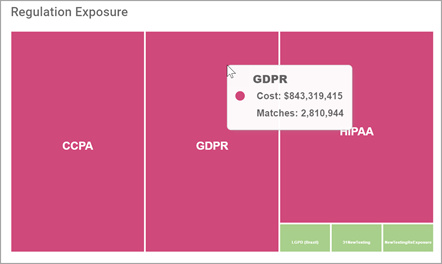
Regulation Exposure
Regulation Exposure displays the dollar value and match count of data identified in Assets with a regulation property.
-
Regulation Exposure: GDPR, HIPAA, etc.
-
Asset Regulation Assignment in Data Asset Inventory
-
Scanned Targets Assigned to Assets in Data Asset Inventory
-
The dollar value of each regulation is indicated by the size and color of the squares in the chart
-
The highest Dollar value is always depicted in Alert Pink
-
Hover over a section for more detail
Note: For Regulation Exposure to be accurate, you must set up Assets in your Data Asset Inventory (DAI) and include relevant regulations. See Getting Started with Data Asset Inventory for more information.