
User Guide
How to Use the Scans Dashboard
The Scans Dashboard displays an overview of the scan results across your entire environment.
The Scans Dashboard includes the following categories of reports (displayed within tiles in the Spirion Sensitive Data Platform user interface):
See below for more information:
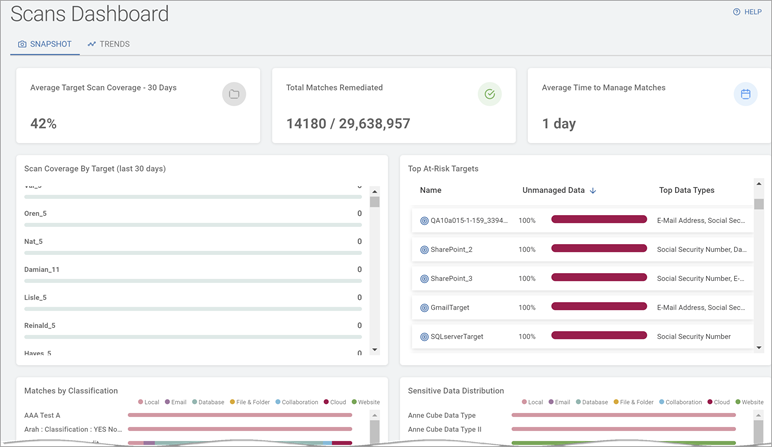
SNAPSHOT View
Totals Overview
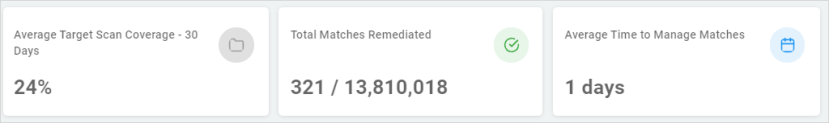
The Totals Overview displays data in tiles:
- Average Target Scan Coverage - 30 days (by percentage)
- Percent of all valid Targets in the Data Asset Inventory (DAI) that have been scanned in the past 30 days.
This number should be as close to 100% as possible.
- Total Matches Remediated (out of total matches)
- The number of sensitive data matches that have been remediated (quarantined, redacted, deleted, etc.) out of the total number of matches discovered (by all scans).
- The gap between these two numbers should be as small as possible.
- Ideally, these numbers match (Example: 10,000/10,000)
- Average Time to manage matches (in days)
Average amount of time (in days), from when the sensitive data match was discovered by a scan to when it was acted upon (quarantined, redacted, deleted, etc.).
This number should be as low as possible given your environment and Agent count.
For Large organizations with thousands of Agents:
Approximately 1 week is recommended.
A value of 1 month or more is considered high risk.
For Small organizations with 10-20 Agents:
1-2 days is recommended.
A value of 1 week or more is considered high risk.
Your goal is to keep this number as low as possible.
This number should trend lower over time.
Scan Coverage By Target (last 30 days)
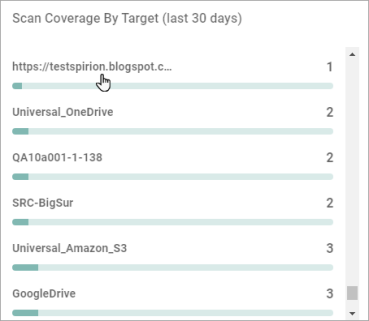
- Display the number of scans performed on different Targets (in the Data Asset Inventory) in the past 30 days
- The scan count for Targets displays in ascending order in the grid.
- Click a Target - or its scan count - to display the Target Details screen.
- Displays, at a glance, which Targets do not have proper coverage.
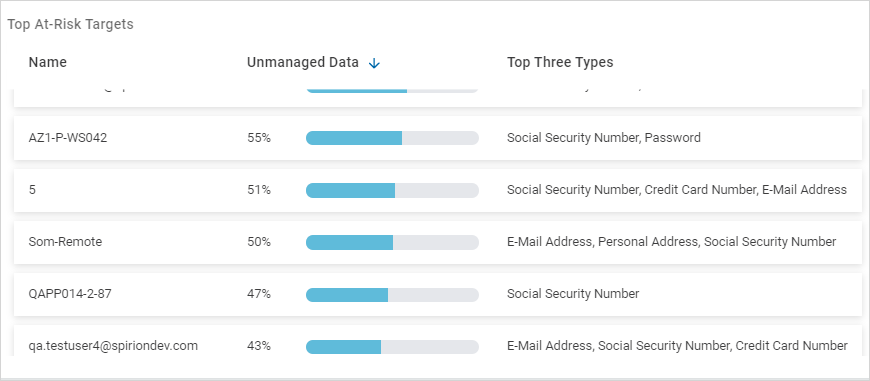
Top At-Risk Targets
-
Display a list of Targets most at-risk due to the amount of Unmanaged sensitive data they contain. These Targets are noteworthy because they contain Unmanaged sensitive data.
-
Unmanaged data in Spirion Sensitive Data Platform is sensitive data that has NOT been remediated in the following ways to lessen or eliminate the risk to your organization:
-
Quarantined
-
Redacted
-
Encrypted
-
Shredded
-
IgnoreLocation
-
Classified
-
Script (executed against the data)
-
Permissions (Access restricted)
-
Ignored
-
GloballyIgnored
-
UserAction taken on data
-
MipLabel applied to data
-
-
Data that has received the following actions is still considered unmanaged:
-
Assigned
-
Notified
-
-
See Add a New Scan Playbook/Select Action for more details about these actions.
-
-
Name: Name of the at-risk Targets.
-
Top Three Types: Top three types of sensitive data contained in the Target. For example, social security number, credit card number, password, etc..
Target Sort
Targets are sorted by:
-
Name - The name of the Target
-
Unmanaged Data (percentage) - What percent of the sensitive data on the Target sources (databases, servers, cloud locations, etc.) is Unmanaged data. Unmanaged data is more vulnerable to breaches, malware, and other security threats.
-
Top Data Types - The 3 most discovered types of Unmanaged data. For example, social security numbers, e-mail addresses, credit card numbers, etc.
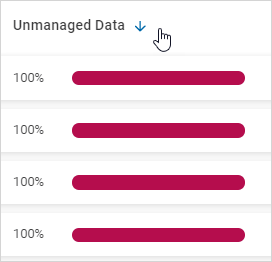
Click the arrow to sort by ascending values, lowest value first, at the top.
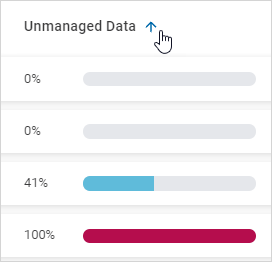
Click the down arrow to sort by descending values, highest value first, at the top.
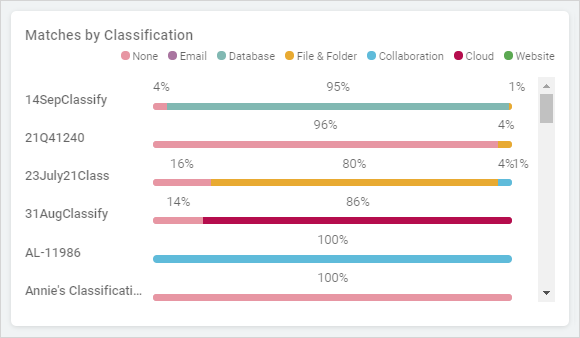
Matches by Classification
-
Displays sensitive data matches sorted by classification name as they are distributed across the various data locations in your environment (expressed as a percent % of whole):
-
None
-
Email
-
Database
-
File & Folder
-
Collaboration
-
Cloud
-
Website
-
-
Example: In the screenshot above, the data classification "14SepClassify" is found in three different locations within your scanned environment:
-
None (not found in any defined location): 4%
-
Database: 95%
-
Files and Folders: 1%
-
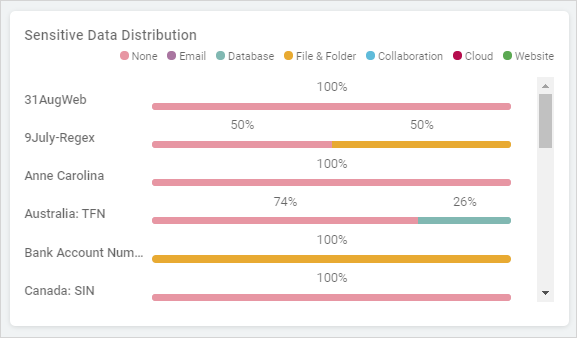
Sensitive Data Distribution
-
Displays sensitive data types as they are distributed across the data locations in your environment (expressed as a percent % of whole):
-
None
-
Email
-
Database
-
File & Folder
-
Collaboration
-
Cloud
-
Website
-
-
Colors: Each data location (which contains sensitive data) is represented by a different color.
-
Impact: In the above example, Bank Account Numbers are found exclusively in the Files and Folders on remote machines.
Consider the following:
-
This may be expected behavior (you may wish to keep this data out of cloud sources).
-
You may wish to confirm this data has been redacted/quarantined or similar remediation action taken to ensure it is secure
-
You may wish to drill down and discover the distribution among local machines - is this data on one machine or several? Are these machines secure? Do they use proper password strength, etc.?
-
TRENDS View
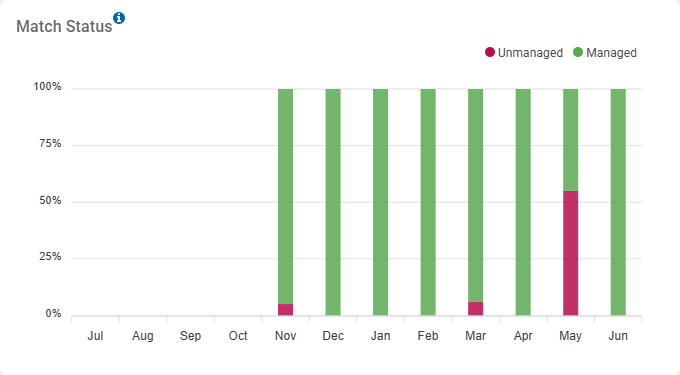
Match Status
-
What percent (%) of scanned content is stored on Managed or Unmanaged sources over time (by month).
-
Colors: Unmanaged data is shown in red. Managed data is shown in green.
-
Impact: An environment with a large amount of unmanaged data is at greater risk of data breach, malware, data loss and other security threats than an environment with managed data.
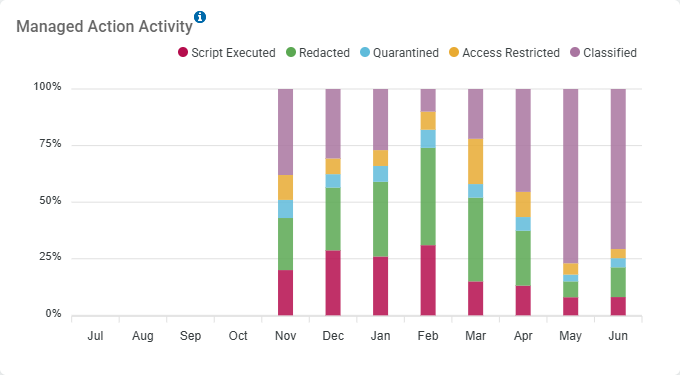
Managed Action Activity
-
The percent (%) of various remediation actions (performed on data sources) over time (by month).
Once these actions are applied to sensitive data that data is considered managed by Sensitive Data Platform.
These actions make your data more secure and reduce sensitive data risk in your environment.
-
Actions include:
-
Access Restricted
-
Classified
-
Quarantined
-
Redacted
-
Script Executed
-
-
-
Colors: Each action on managed data is represented by a different color.
-
Impact: Managed data are displayed over time (measured monthly), revealing changes in action activity. This is useful in understanding the trend of how remediation actions are being applied to your sensitive data.
-
More information about unmanaged vs managed data.
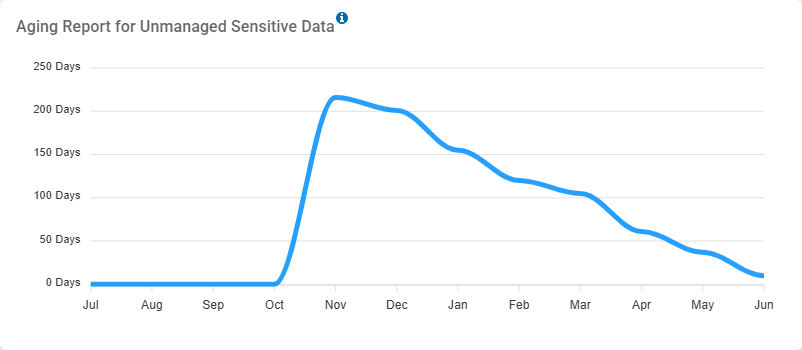
Aging Report for Unmanaged Sensitive Data
-
The age (in days) of all of the Unmanaged sensitive data in your environment.
-
Unmanaged data is sensitive data that has been not acted upon (no action) or else has been acted upon in the following ways:
-
Assigned
-
Notified
-
-
Unmanaged data is at greater risk of security breach.
-
Data classified as Unmanaged MUST BE addressed in a timely fashion. The older your unmanaged data, the greater the risk to your organization!
-
More information about unmanaged vs managed data.
-